
Plik:Health care cost rise.svg

Wielkość pliku podglądu PNG dla pliku SVG: 750 × 440 pikseli Inne rozdzielczości: 320 × 188 pikseli | 640 × 375 pikseli | 1024 × 601 pikseli | 1280 × 751 pikseli | 2560 × 1502 pikseli.
Rozmiar pierwotny (Plik SVG, nominalnie 750 × 440 pikseli, rozmiar pliku: 15 KB)
| Plik Health care cost rise.svg znajduje się w Wikimedia Commons – repozytorium wolnych zasobów. Dane z jego strony opisu znajdują się poniżej. |
Opis
| Opis |
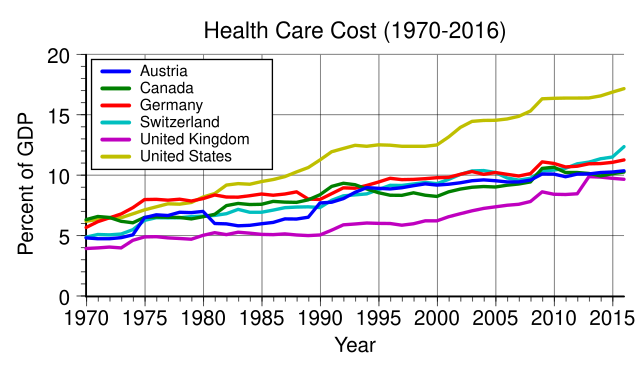
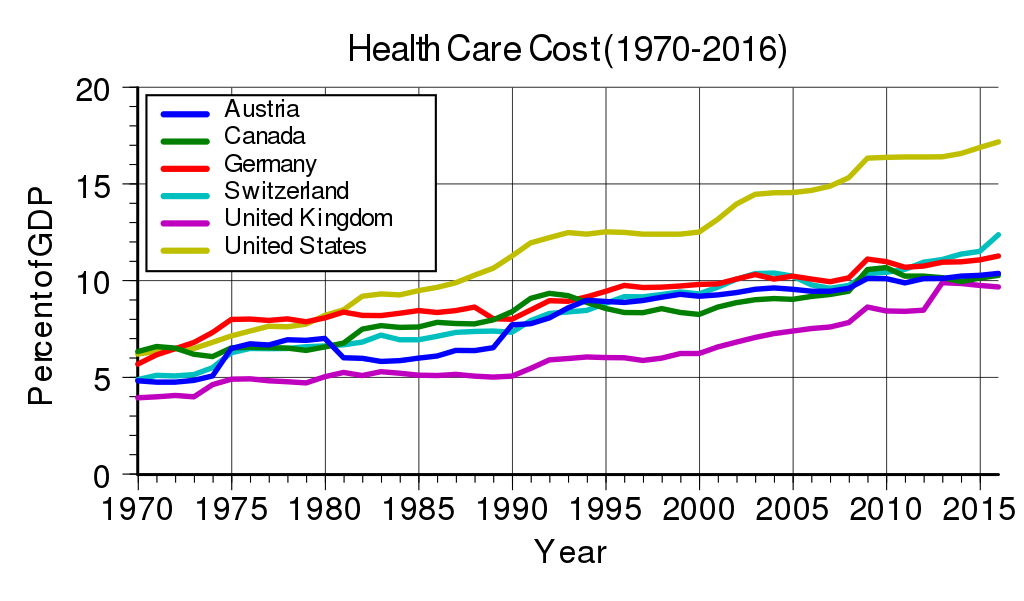
English: Health care cost rise based on total expenditure on health as percent of GDP. Countries are USA, Germany, Austria, Switzerland, United Kingdom, and Canada. See: OECD iLibrary. Health expenditure and financing. And: OECD Data. Health resources - Health spending . See also: en:List of countries by total health expenditure per capita. |
| Data | (date of first version of the chart here on the Commons). |
| Źródło | Praca własna |
| Autor | WikiBasti |
| Inne wersje | Health care cost rise.PNG |
| SVG rozwój | Kod źródłowy tego poprawny. Ta grafika wektorowa została stworzona za pomocą Other tools This file uses embedded text that can be easily translated using a text editor. |
Generated with Wikimedia SVG Chart
| Data format | The source data of the chart is in the SVG image file in a clearly readable format. You see the original numbers inside of the SVG file in the form of a list such as this:
... 1995 10.06 1996 11.75 1997 12.45 ... |
| Content of SVG | To view the data download the SVG file itself. To do so right-click this link, and then choose the option to save: File:Health care cost rise.svg. Launch any text editor. Open the downloaded SVG file with the text editor (usually; file menu, open). To see the list of data, search for the phrase id="graph1". |
| Please, do not use a special SVG editor such as Inkscape; the readability of the database would be destroyed. You can edit the SVG file with any text editor, for example; en: List of text editors. You can view the edited SVG file in various web browsers. As of 2011, all major desktop browsers, and many minor ones, have some level of SVG support. See: en: Scalable Vector Graphics#Support for SVG in web browsers. When satisfied with your edits, upload the edited SVG file with the link labeled "Upload a new version of this file".
W3C-validity not checked. This chart was created with Wikimedia SVG Chart. This chart uses embedded text/digits. |
|
| Code to generate SVG | See: File talk:Health care cost rise.svg. Documentation see: Wikimedia SVG Chart. |
Licencja
| Ja, właściciel praw autorskich do tej pracy, udostępniam ją jako własność publiczną. Dotyczy to całego świata. W niektórych krajach może nie być to prawnie możliwe, jeśli tak, to: Zapewniam każdemu prawo do użycia tej pracy w dowolnym celu, bez żadnych ograniczeń, chyba że te ograniczenia są wymagane przez prawo. |
Historia pliku
Kliknij na datę/czas, aby zobaczyć, jak plik wyglądał w tym czasie.
| Data i czas | Miniatura | Wymiary | Użytkownik | Opis | |
|---|---|---|---|---|---|
| aktualny | 23:10, 8 paź 2017 | | 750 × 440 (15 KB) | Delphi234 | update |
| 17:15, 11 wrz 2016 |  | 750 × 440 (15 KB) | Delphi234 | update | |
| 04:02, 17 maj 2016 |  | 750 × 440 (15 KB) | Delphi234 | update | |
| 15:15, 24 mar 2010 |  | 896 × 420 (30 KB) | WikiBasti | different size | |
| 15:13, 24 mar 2010 | 860 × 240 (30 KB) | WikiBasti | different size | ||
| 14:44, 24 mar 2010 |  | 512 × 240 (30 KB) | WikiBasti | {{Information |Description={{en|1=Data Source [http://www.irdes.fr/EcoSante/DownLoad/OECDHealthData_FrequentlyRequestedData.xls] (OECD Health Data 2009). Health care cost rise based on total expenditure on health as % of GDP. Countries are USA, Germany, A |
Lokalne wykorzystanie pliku
Poniższa strona korzysta z tego pliku:
Globalne wykorzystanie pliku
Ten plik jest wykorzystywany także w innych projektach wiki:
- Wykorzystanie na ar.wikipedia.org
- Wykorzystanie na az.wikipedia.org
- Wykorzystanie na de.wikipedia.org
- Wykorzystanie na en.wikipedia.org
- Wykorzystanie na es.wikipedia.org
- Wykorzystanie na fa.wikipedia.org
- Wykorzystanie na ja.wikipedia.org
- Wykorzystanie na ko.wikipedia.org
- Wykorzystanie na pt.wikipedia.org
- Wykorzystanie na ru.wikipedia.org
- Wykorzystanie na sr.wikipedia.org
- Wykorzystanie na sv.wikipedia.org
- Wykorzystanie na zh.wikipedia.org